Here's how to make a windows lagscreen like effect using matplotlib on python. We are beyond asking why would anyone need this at this point.
plt.figure()
ax1 = plt.gcf().add_axes([0,0,0.5,0.5])
ax1.scatter([1,2,3],[3,4,5])

ax2 = plt.gcf().add_axes([0.6,0,0.5,0.5])
ax2.scatter([1,2,3],[3,4,5])

ax3 = plt.gcf().add_axes([0.35,-0.4,0.5,0.5])
ax3.scatter([1,2,3],[3,4,5])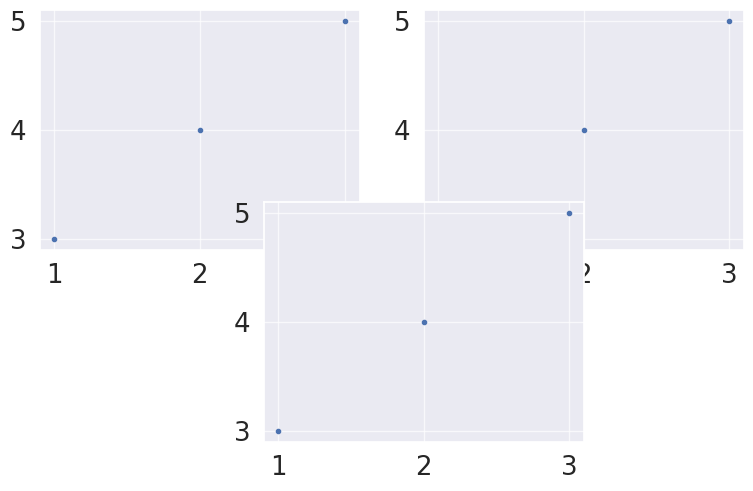
plt.figure()
x = np.arange(0,1,0.05)
y = -x-1

for i in range(len(x)):
    ax1 = plt.gcf().add_axes([x[i],y[i],0.5,0.5])
    ax1.scatter(0,0)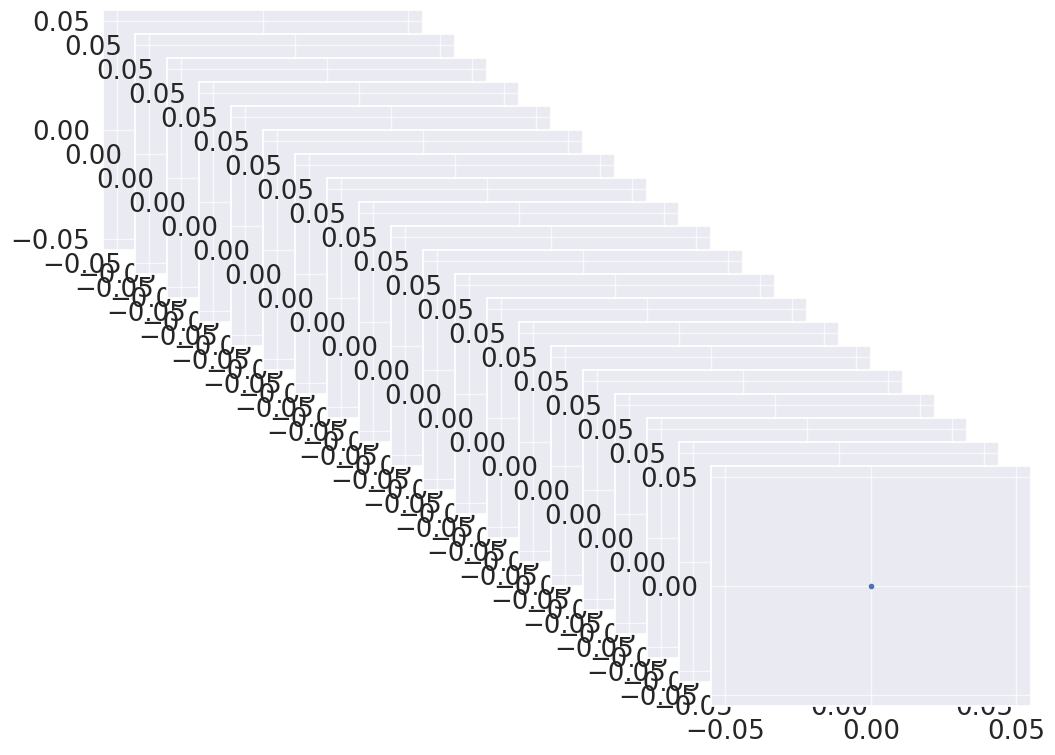
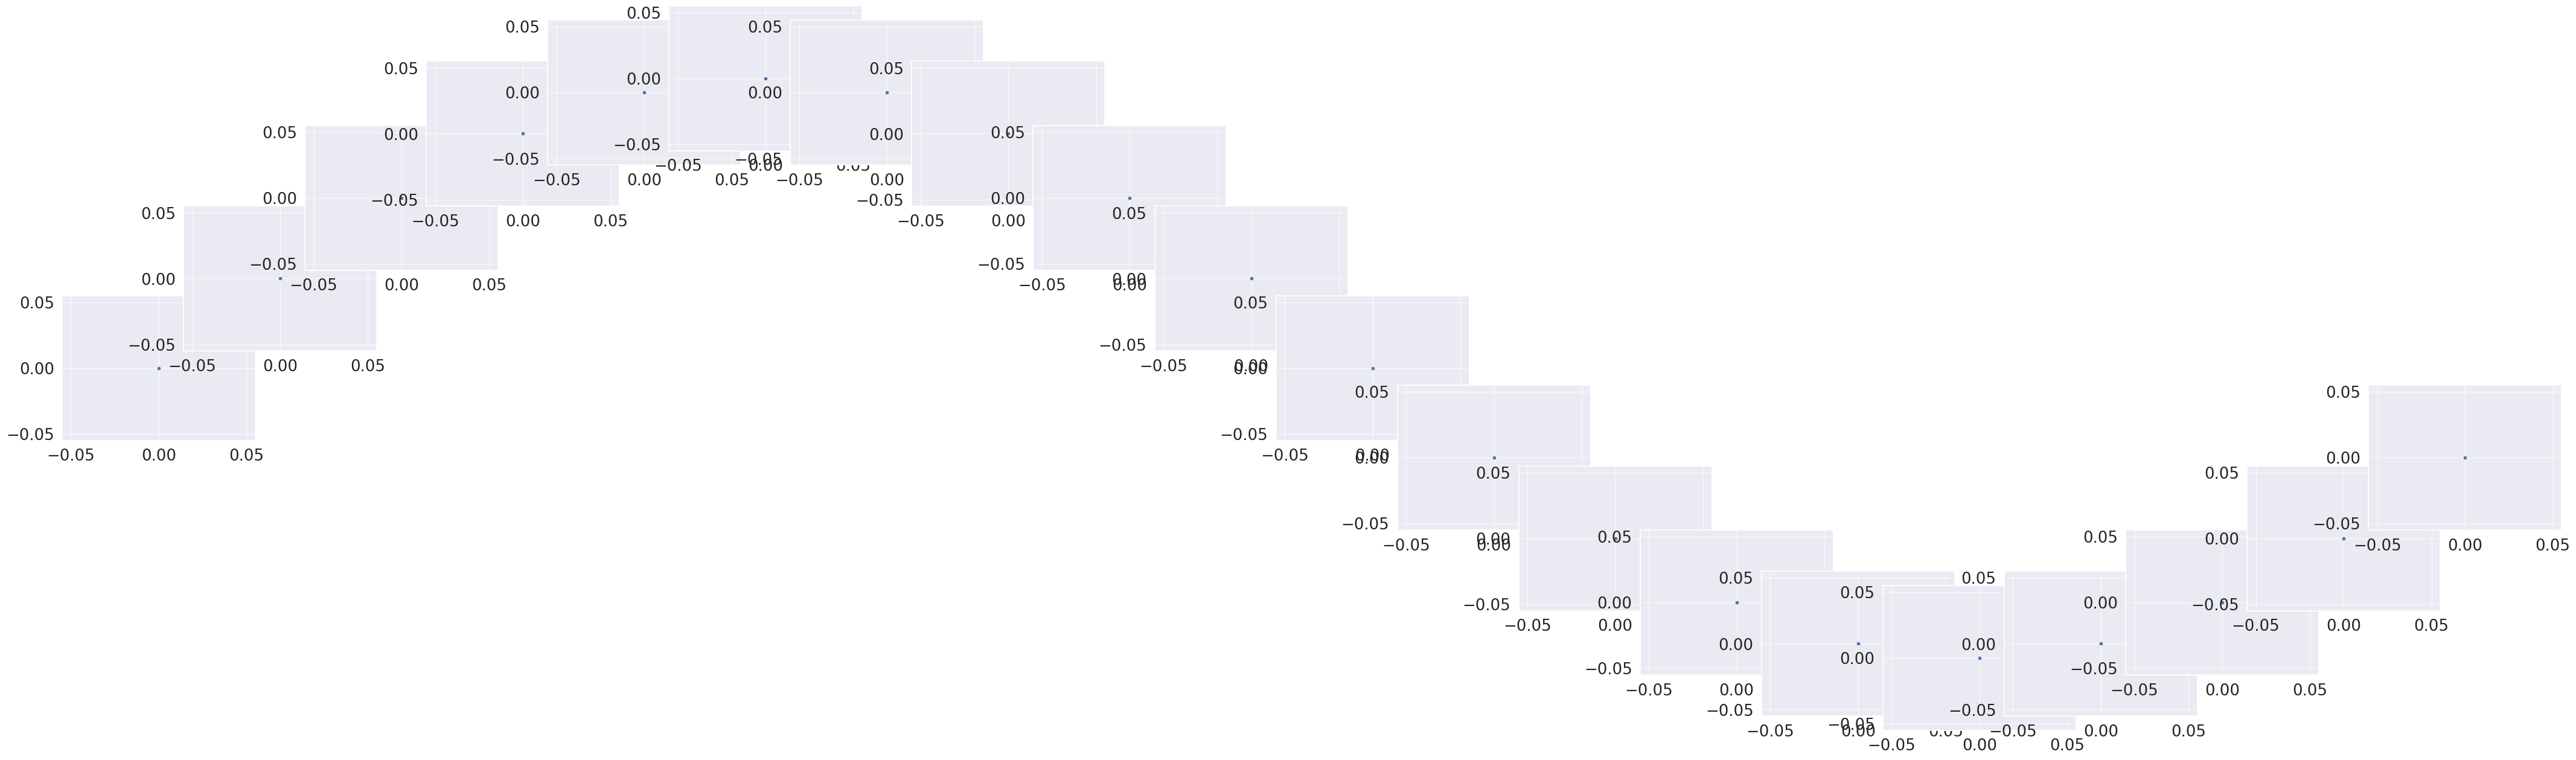
plt.figure()
x = np.arange(0,1,0.05)*np.pi*2
y = np.sin(x)

for i in range(len(x)):
    ax1 = plt.gcf().add_axes([x[i],y[i],0.5,0.5])
    ax1.scatter(0,0)